
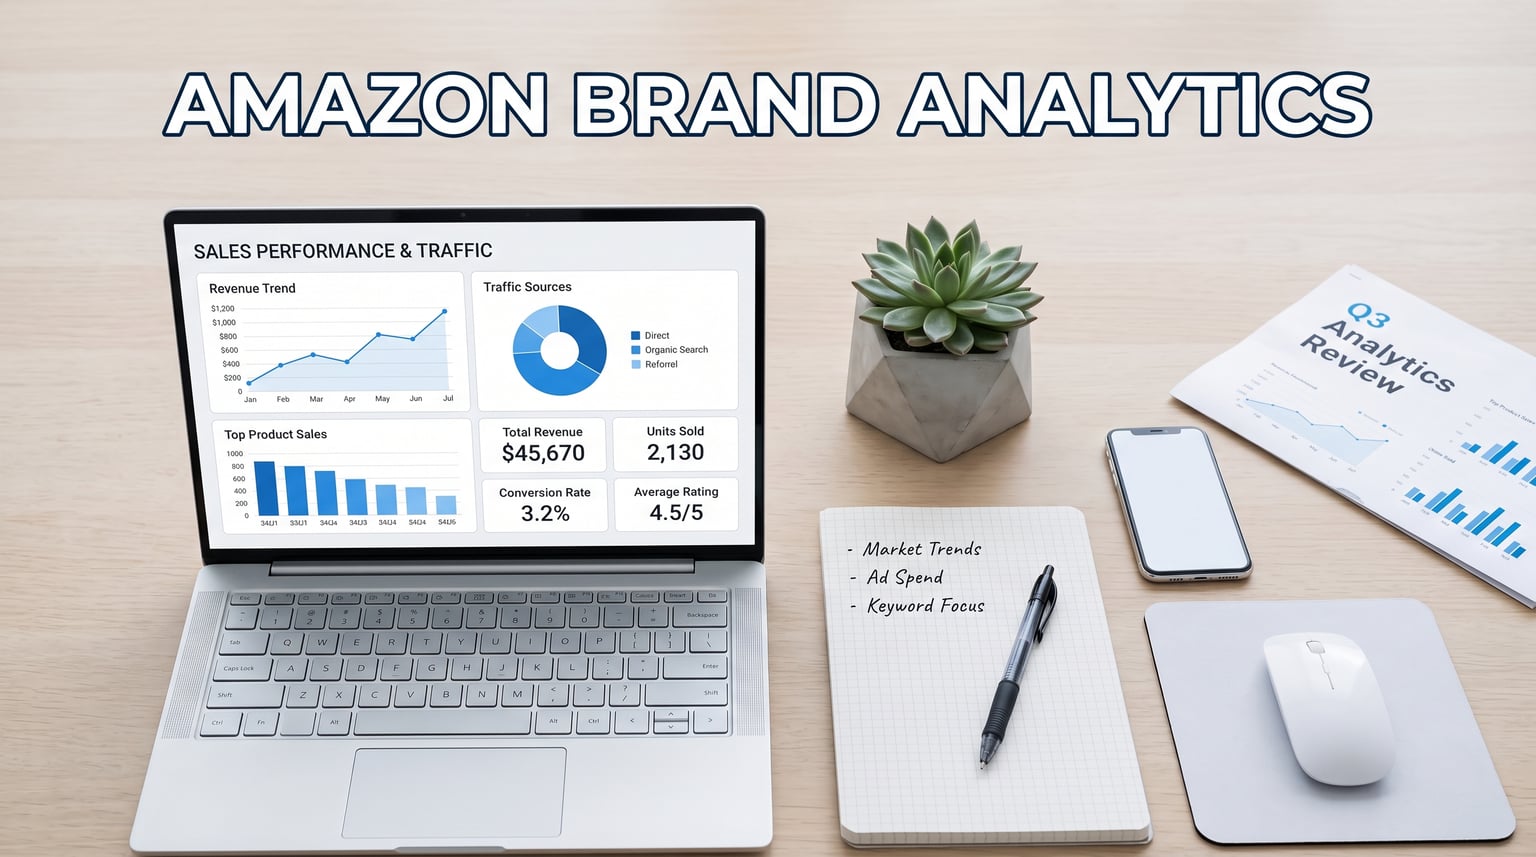
Amazon Brand Analytics (ABA) is a free suite of reporting tools within Amazon Seller Central that gives enrolled brand owners direct access to customer search behavior, purchase patterns, and audience demographics. Instead of relying on third-party estimate tools, sellers enrolled in Brand Registry get first-party data straight from Amazon itself. For anyone serious about growing a private-label business on the platform in 2026, understanding every report inside ABA is foundational.
I have spent years working with Amazon sellers, and the gap between those who actively use ABA and those who ignore it is striking. Sellers who mine these reports for keyword opportunities, cross-sell patterns, and shopper demographics consistently outperform competitors who guess their way through listing optimization and PPC management. The data is already sitting in your Seller Central account, refreshing on a weekly basis, waiting to be put to work.
This guide walks through every current report inside Amazon Brand Analytics, updated for 2026. I cover who qualifies, how to find the tool, what each dashboard does, and how to turn the numbers into practical actions for listing optimization, PPC campaigns, and customer retention strategies. I also address the discontinued Item Comparison report, the new Custom Analytics tool, and the difference between ABA and Amazon Retail Analytics.
What you will learn:
- What Amazon Brand Analytics is and why Amazon offers it for free
- Eligibility requirements and how ABA differs from Amazon Retail Analytics (ARA)
- Step-by-step navigation to find the tool in the current Seller Central interface
- Detailed breakdowns of all six active ABA reports plus Customer Loyalty Analytics
- Practical use cases for listing optimization, PPC management, product research, and more
- New features added in the 2025 to 2026 period, including the Custom Analytics tool
What Is Amazon Brand Analytics?
Amazon Brand Analytics is a reporting suite built directly into Amazon Seller Central, available at no extra cost to sellers enrolled in Amazon Brand Registry. It surfaces aggregated customer data, search behavior insights, and product performance metrics that third-party tools can only estimate. The suite is organized into a series of dashboards, each focused on a specific dimension of how shoppers discover, evaluate, and purchase your products.
First launched in early 2019, ABA replaced the paid Amazon Retail Analytics Premium offering that once cost sellers hundreds of dollars per month. By making the tool free for Brand Registry members, Amazon encouraged sellers to invest more in content quality, advertising, and inventory depth, all of which benefit the marketplace as a whole. The data refreshes weekly in most dashboards, with reporting ranges available in daily, weekly, monthly, and quarterly intervals depending on the report.
For a deeper look at one of the most commonly used reports, see our companion guide on the Amazon Search Terms Report. It breaks down search frequency rank, click share, and conversion share in greater detail than this overview covers.
Understanding Why It Matters
- Better decision making: ABA replaces guesswork with actual customer behavior data, letting you prioritize keywords and products based on real shopping activity rather than intuition.
- Enhanced product visibility: When you understand what shoppers search for and how often, you can align listing copy and backend keywords with proven demand signals.
- Competitive intelligence: Several ABA reports reveal which competing ASINs capture clicks and conversions for search terms relevant to your brand, giving you a benchmark for performance.
The reason ABA matters more than ever in 2026 comes down to one advantage: first-party accuracy. Every metric in these dashboards originates from actual Amazon shopper activity. Third-party tools estimate this same data through scraping and modeling, which introduces variance. When you make decisions about inventory spend, advertising budgets, or listing rewrites, the confidence level should be as high as possible.
How It Provides Insights
Amazon Brand Analytics currently organizes its data into six primary dashboards plus the newer Customer Loyalty Analytics view. Each dashboard answers a different business question. The Search Terms Report shows what customers type into the Amazon search bar. The Search Query Performance Report reveals how your brand performs across the search shopping funnel, from impressions through purchases. The Search Catalog Performance Report applies that same funnel view to individual ASINs.
On the purchase-behavior side, the Market Basket Analysis reveals which products customers buy together, the Repeat Purchase Behavior Report tracks how often shoppers return to your brand, and the Demographics Report breaks down your buyer base by age, income, education, gender, and marital status. Customer Loyalty Analytics goes a step further by segmenting shoppers into cohorts like Top Tier, Promising, At Risk, and Hibernating. Together, these dashboards cover the full customer journey from discovery through retention.
Who Can Use Amazon Brand Analytics?
Access to Amazon Brand Analytics requires two things: an active Professional Selling Plan and enrollment in Amazon Brand Registry. Let me break down what each requirement means and clear up a common misconception about who qualifies.
Professional Selling Plan
The Professional Selling Plan is Amazon’s subscription tier for sellers who expect to move more than 40 units per month. It costs a flat monthly fee and unlocks access to bulk listing tools, advertising features, and reporting suites like ABA. Individual plan sellers, who pay per-item fees instead of a monthly subscription, do not have access to Brand Analytics.
Amazon Brand Registry Enrollment
Brand Registry is Amazon’s program for protecting intellectual property on the marketplace. To enroll, you need an active registered trademark in the country where you sell. Once enrolled, your brand gains access to enhanced content tools like A+ Content, Sponsored Brands advertising, Stores, and of course Brand Analytics. Brand Registry has been a mandatory gate for ABA access since 2020.
ABA vs ARA: Seller Central vs Vendor Central
One point that causes frequent confusion is the distinction between Amazon Brand Analytics and Amazon Retail Analytics, often abbreviated as ARA. ABA lives inside Seller Central and serves sellers who list and sell products themselves. ARA lives inside Vendor Central and serves vendors who sell products wholesale to Amazon. The two tools overlap in some data types but exist for entirely different business models.
If you are a first-party vendor working through Vendor Central, you will use Amazon Retail Analytics rather than ABA. ARA comes in Basic and Premium tiers, with the Premium tier carrying a monthly fee. If you are a third-party seller on the Professional Selling Plan with Brand Registry, you use ABA at no cost. Some sellers operate in both channels simultaneously, which means they may have access to both tools, but the majority of private-label sellers will work exclusively with ABA inside Seller Central.
Geographic and Permission Levels
ABA access is also tied to the specific marketplace where your Brand Registry is enrolled. A seller enrolled in the US marketplace sees US shopper data. Sellers with Brand Registry across multiple North American or European marketplaces can switch between them within the tool. Additionally, account administrators can grant or restrict ABA access for individual users within a Seller Central account, which matters for agencies managing multiple brands.
Is Amazon Brand Analytics Free?
Yes, Amazon Brand Analytics is completely free for eligible sellers. There is no monthly subscription, no per-report fee, and no usage cap. As long as you maintain your Professional Selling Plan and Brand Registry enrollment, every dashboard is available to you.
You might wonder why Amazon gives this data away at no cost. The answer comes down to alignment of incentives. When sellers have better data, they create better listings, run more effective advertising campaigns, and stock products that match demand. All of those outcomes drive more sales on Amazon, which means more revenue from referral fees and advertising spend. Amazon also benefits because sellers who invest in data-driven optimization are less likely to abandon the platform.
This free access is one of the strongest trust signals for the tool. Reddit sellers consistently recommend ABA as a foundational resource rather than an optional extra. Many note that the data inside ABA, especially search frequency rank and click share metrics, is more reliable than paid third-party estimates because it comes directly from Amazon’s own shopper activity logs.
How Do You Find the Amazon Brand Analytics Tool?
Finding ABA in Seller Central has changed over the years, and the navigation path described in older guides no longer works. Amazon has reorganized its menus, so let me walk you through the current route as of 2026. There are two primary paths to reach Brand Analytics from your Seller Central dashboard.
Path 1: Through the Reports Menu
- Log in to Amazon Seller Central with your professional seller credentials.
- From the main navigation bar at the top, hover over Reports.
- Select Brand Analytics from the dropdown menu.
- You will land on the Brand Analytics dashboard, which displays all available reports as selectable cards.
Path 2: Through the Brands Menu
- From the Seller Central main menu, click on the hamburger icon (three horizontal lines) in the top-left corner.
- Navigate to Brands in the sidebar.
- Select Brand Analytics from the expanded options.
- The same dashboard view appears, giving you access to every report your brand qualifies for.
If you do not see Brand Analytics in either location, double-check that your Brand Registry enrollment is active and that your user permissions include analytics access. Account admins can adjust permissions under Settings, then User Permissions.
Using the Download Manager
Many ABA reports can be exported for offline analysis. When you request a report download, the file processes asynchronously and appears in the Download Manager, accessible from the top navigation bar. Large reports, especially Search Terms data spanning a full quarter, can take several minutes to generate. The Download Manager keeps a history of your requested files so you can retrieve them later without re-running the report.
Amazon Brand Analytics Reports: The Six Active Dashboards
Amazon Brand Analytics currently includes six primary report types plus the newer Customer Loyalty Analytics view. Each report answers a distinct question about your customers and products. Let me walk through each one in detail.
1. Amazon Search Terms Report
The Search Terms Report is the most widely used dashboard in ABA. It shows the most popular search phrases Amazon shoppers typed over a selected reporting period, along with the top-clicked ASINs for each term. Reporting ranges are available in daily, weekly, monthly, and quarterly intervals.
Search Frequency Rank
Every search term in the report carries a Search Frequency Rank, which indicates how popular that phrase is relative to all other searches on Amazon. A rank of 1 means it was the most searched term on the platform during that period. Lower rank numbers mean higher search volume. This metric helps you prioritize which terms deserve the most attention in your listing optimization and PPC campaigns.
Click Share and Conversion Share
For each search term, the report lists the top three ASINs that received clicks after shoppers entered that phrase. Click Share tells you what percentage of total clicks on the search results page went to a specific ASIN. Conversion Share indicates what percentage of purchases from that search term went to that ASIN. If your ASIN has a high click share but low conversion share, your listing attracts attention but fails to close the sale, which signals a need for improved images, pricing, or review quality.
Clicked ASIN and Product Title
The report identifies each clicked ASIN by its unique identifier and shows the product title associated with it. Studying which titles win clicks for your target search terms provides concrete inspiration for your own listing copy. If a competitor’s title includes a specific feature phrase and consistently captures top click share, that phrasing clearly resonates with shoppers searching that term.
2. Search Query Performance Report
The Search Query Performance Report is one of the most powerful additions to ABA in recent years. It shows the top search queries that led customers to your brand’s products, going beyond raw click data to reveal the full search shopping funnel. For each query, you see impressions, click-through rate (CTR), cart adds, purchase rate, and conversion rate.
This report exists in two views: a brand-level view and an ASIN-level view. The brand-level view aggregates performance across all your products for a given search query. The ASIN-level view lets you drill into how a specific product performs for that term. Sellers on forums frequently use this report to identify cannibalized keywords, meaning terms where paid ads and organic results compete against each other, driving up ad spend without increasing total sales.
Another common workflow involves finding keywords with high impressions but low CTR. These are terms where your product appears in results but shoppers rarely click. The fix usually involves improving your main image, adjusting pricing, or revising your title to better match what the searcher expects to see.
3. Search Catalog Performance Report
Where the Search Query Performance Report focuses on search terms, the Search Catalog Performance Report focuses on your product catalog. It shows how each ASIN performs across the search shopping funnel, with metrics for impressions, clicks, CTR, cart adds, purchases, and conversion rate. This report helps you identify which products are overperforming or underperforming in organic search.
I find this report especially useful for diagnosing listing problems. An ASIN with strong impressions and decent clicks but a low conversion rate likely has a listing quality issue. Perhaps the images do not match what shoppers expect, or the bullet points fail to address common objections. An ASIN with low impressions across the board may simply lack keyword relevance and need a backend search term overhaul.
4. Market Basket Analysis
The Market Basket Analysis shows what else customers bought alongside your products during the same shopping session. For each of your ASINs, the report lists the most commonly co-purchased ASINs and the percentage of orders where that combination occurred. This data is gold for cross-selling and upselling strategies.
Combination Percentage Explained
The Combination Percentage, sometimes called the Combination Rate, represents how often a specific product appeared in the same order as your ASIN. For example, if 65 percent of orders containing your coffee maker also included a specific water filter, that combination rate tells you exactly what bundle to build or which complementary product to stock.
Practical Applications
Sellers use Market Basket data to create product bundles, design cross-promotion campaigns, and identify gaps in their catalog. If customers consistently pair your product with an accessory from another brand, that accessory represents a product development opportunity. Forum users also report using this data to optimize Subscribe and Save offers by bundling consumable items that shoppers already purchase together.
5. Repeat Purchase Behavior Report
The Repeat Purchase Behavior Report tracks how many customers return to buy your products again within a given timeframe. It shows total unique customers, repeat customers, and the repeat purchase rate broken down by ASIN. This report is one of the clearest indicators of product satisfaction available, since returning buyers signal genuine value.
Sellers on Reddit consistently recommend using this data to decide which products to enroll in Subscribe and Save. Products with naturally high repeat purchase rates are ideal candidates for subscription programs, which lock in recurring revenue and improve cash flow predictability. Conversely, products with low repeat rates may benefit from consumable add-ons or refill packs that give shoppers a reason to return.
The report also helps identify brand loyalty trends. If your repeat purchase rate is climbing over consecutive quarters, your retention efforts are working. If it drops, you may be losing customers to competitors who entered the category with better pricing or improved features.
6. Demographics Report
The Demographics Report breaks down your customer base by age range, household income, education level, gender, and marital status. Each dimension is expressed as a percentage distribution and compared against the Amazon-wide average for that category. This comparison tells you whether your brand skews toward a particular demographic segment.
One limitation worth noting is that the Demographics Report requires a minimum of 100 unique customers within the selected reporting period to display data. Newer sellers or those with lower sales volumes may see empty reports until they reach this threshold. Forum discussions frequently mention this as a frustration for small or seasonal brands.
The insights from demographics can directly shape marketing strategy. If your data shows a strong skew toward higher household income brackets, you can position your product as a premium offering and adjust ad targeting accordingly. If your audience leans younger, imagery and messaging on your detail page should reflect that demographic’s preferences.
Customer Loyalty Analytics
Customer Loyalty Analytics is a newer addition that segments your buyer base into behavioral cohorts. Shoppers are categorized into segments such as Top Tier, Promising, At Risk, Hibernating, and Cart Abandoners. Each segment reflects a different level of engagement with your brand, from your most loyal repeat buyers to shoppers who added items to their cart but never completed checkout.
This report helps you tailor retention strategies by cohort. Top Tier customers might receive exclusive offers or early access to new products. At Risk customers, who have not purchased in a while, might be reactivated through targeted promotions. Cart Abandoners represent an immediate conversion opportunity if you can address whatever objection stopped them from completing the purchase.
For related strategies on managing the customer feedback that feeds into loyalty, see our guide on handling bad reviews on Amazon. Negative reviews directly impact repeat purchase rates and customer loyalty metrics.
A Note on the Discontinued Item Comparison Report
Older guides reference a seventh report called Item Comparison and Alternate Purchase Behavior. This dashboard showed which competing ASINs shoppers compared your product against and which alternatives they ultimately purchased instead. Amazon discontinued this report in June 2022, and it no longer appears in the Brand Analytics dashboard.
While the Item Comparison report is gone, some of its functionality has been absorbed by other dashboards. The Search Query Performance Report now reveals which competitors capture clicks and conversions for search terms relevant to your brand. The Search Terms Report’s click share data also shows which competing ASINs win shopper attention for specific keywords. Together, these reports provide competitive intelligence that partially replaces what the Item Comparison report once offered.
What Is New in Amazon Brand Analytics (2025 to 2026)
Amazon has added several capabilities to Brand Analytics over the past two years. If you have not logged into the tool recently, here is what has changed.
Custom Analytics Tool
The Custom Analytics tool is the most significant recent addition. It allows sellers to build tailored reports using pre-built templates that combine data from multiple ABA dashboards. Instead of jumping between the Search Terms Report and the Market Basket Analysis, you can create a single view that layers search behavior with purchase patterns. This reduces the manual effort of exporting and cross-referencing separate reports.
Enhanced Visualization Dashboard
Amazon has upgraded the visualization layer across ABA dashboards. Reports now include interactive charts and graphs that make trend spotting faster than scanning raw data tables. The enhanced visualization dashboard is especially useful for the Search Query Performance and Search Catalog Performance reports, where funnel metrics like impressions, CTR, cart adds, and conversion rate benefit from visual comparison.
Amazon Attribution Integration
Amazon Attribution, which measures how non-Amazon marketing channels like Google Ads, Facebook Ads, and email campaigns drive traffic and sales on Amazon, is increasingly integrated alongside ABA data. While technically a separate tool, it appears in the same analytics ecosystem and helps sellers understand the full picture of how external marketing influences on-platform shopping behavior. For sellers running multi-channel campaigns, combining Attribution data with ABA insights creates a more complete view of customer acquisition.
How to Use Amazon Brand Analytics: Practical Use Cases
Knowing what each report does is only half the equation. The real value comes from translating data into action. Here are the most effective ways experienced sellers put ABA to work.
Listing Optimization
The Search Terms Report is your primary tool for listing optimization. Start by identifying high-frequency search terms relevant to your product that you are not currently ranking for organically. Add these terms to your title, bullet points, and backend search terms field. Next, use the Search Catalog Performance Report to identify ASINs with low impressions, which signals weak keyword relevance. Rewrite listings for these products with priority keywords from the Search Terms data.
Pay attention to click share trends over time. If your click share for a target term is declining while a competitor’s share rises, examine what changed in their listing. They may have added a feature to their title, improved their main image, or adjusted pricing. Use that intelligence to guide your next listing revision.
PPC Management
The Search Query Performance Report is essential for PPC management. Identify keywords where your product receives strong organic impressions but you are also running paid ads. These may be cannibalized keywords, where your ad spend simply replaces sales you would have captured organically. Experienced sellers recommend pausing PPC for these terms temporarily and measuring the impact on total sales to confirm cannibalization.
Conversely, look for keywords with low organic impressions but high search frequency rank. These represent terms where strong demand exists but your product rarely appears in results. Bidding aggressively on these terms in PPC can help you gain visibility while you work on improving organic ranking through listing optimization and sales velocity.
Product Research and Development
Market Basket Analysis reveals what customers buy alongside your products, which can inform product expansion decisions. If shoppers consistently pair your product with an accessory you do not sell, consider developing or sourcing that accessory. The Demographics Report adds another layer, showing whether your audience skews toward a segment that values premium features or budget options.
Repeat Purchase Behavior data helps validate product quality before scaling. A high repeat purchase rate confirms that your product satisfies customers, making it a safer candidate for expanded inventory and advertising investment. Low repeat rates may signal quality issues that need resolution before doubling down on growth spend.
Customer Retention Strategies
Customer Loyalty Analytics and the Repeat Purchase Behavior Report together form the foundation of a retention strategy. Segment your audience by loyalty cohort and tailor messaging accordingly. For Top Tier customers, consider creating a loyalty program or offering early access to new launches. For At Risk customers, deploy win-back campaigns with targeted discounts.
Products with strong repeat purchase metrics are ideal candidates for Subscribe and Save enrollment, which converts one-time buyers into recurring revenue streams. The data removes the guesswork from deciding which products deserve subscription promotion. For broader context on Amazon business models where these strategies apply, see our comparison of dropshipping vs Amazon FBA.
Challenges and Limitations of Amazon Brand Analytics
ABA is a powerful tool, but it has real limitations that sellers should understand before building their entire strategy around it. Transparency about these constraints helps set realistic expectations.
- Data refresh lag: Most ABA reports update weekly, not in real time. Strategy adjustments based on ABA data inherently lag behind live market conditions by several days.
- Static report formats: While the Custom Analytics tool has improved flexibility, the core dashboards present data in fixed formats. Advanced sellers often export data to external tools like Power BI or Tableau for deeper analysis.
- Data overload: With six dashboards plus Customer Loyalty Analytics, the sheer volume of metrics can overwhelm sellers who lack a structured analysis workflow. Knowing which report to use for which decision is half the battle.
- Minimum customer thresholds: The Demographics Report requires at least 100 unique customers in the selected period to display data. Small or seasonal sellers may find this report empty for long stretches.
- No direct API access for most sellers: While Amazon has introduced API access for some analytics data, full programmatic integration with ABA dashboards remains limited. Sellers seeking automated data pipelines often rely on manual exports through the Download Manager.
- Aggregated data only: ABA shows aggregated trends, not individual customer records. You cannot identify specific shoppers or build lookalike audiences directly from ABA data.
Despite these limitations, forum users consistently rate ABA as a foundational tool that no Brand Registry seller should ignore. The key is pairing it with complementary tools and maintaining a structured workflow for reviewing and acting on the data.
Benefits of Using Amazon Brand Analytics
Improved Keyword Research
Before ABA, keyword research on Amazon relied heavily on third-party tools that estimated search volume through indirect methods. The Search Terms Report replaced those estimates with actual search frequency data from Amazon itself. You can now identify exactly which phrases shoppers use, how often they use them, and which ASINs capture the resulting clicks and conversions. This level of keyword precision directly improves both organic listing optimization and PPC campaign targeting.
Refined Marketing Strategies
ABA data removes guesswork from marketing decisions. Instead of wondering whether a particular feature phrase belongs in your product title, you can check its search frequency rank and click share data. Instead of guessing whether your audience values premium positioning, you can check the Demographics Report for income distribution. Every marketing decision becomes grounded in evidence rather than assumption.
Deeper Understanding of Audience Preferences
The combination of Demographics, Repeat Purchase Behavior, and Customer Loyalty Analytics creates a rich picture of who your customers are and what they value. You learn their age, income bracket, and education level. You discover how often they return and which products inspire loyalty. This understanding lets you tailor everything from product photography to advertising creative to match what your actual audience responds to.
For sellers looking to grow their presence, ABA insights also inform decisions about expanding into new products or categories. When you understand your existing audience deeply, you can identify adjacent product opportunities that your current customers are likely to buy. Our guide on Amazon reviews best practices covers how customer feedback complements this data.
Amazon Brand Analytics FAQs
How to use Amazon Brand Analytics?
Log in to Seller Central, navigate to Reports then Brand Analytics (or Main Menu then Brands then Brand Analytics), and select the report you need. Use the Search Terms Report for keyword research, Search Query Performance for PPC optimization, Market Basket Analysis for cross-selling insights, and Demographics for audience profiling. Review your data weekly and export reports through the Download Manager for deeper offline analysis.
Is Amazon Brand Analytics free?
Yes, Amazon Brand Analytics is completely free for sellers with an active Professional Selling Plan and Brand Registry enrollment. There is no monthly subscription fee, no per-report charge, and no usage cap. Amazon offers it at no cost because better data leads to better listings and advertising, which drives more marketplace activity.
What does an Amazon brand analyst do?
An Amazon brand analyst interprets Brand Analytics data to guide product, marketing, and inventory decisions. They review search frequency trends, analyze click and conversion share, identify cross-selling opportunities from Market Basket data, and track customer retention through Repeat Purchase Behavior and Customer Loyalty Analytics. Their goal is to translate raw dashboard metrics into actionable business strategies.
What is the difference between ABA and ARA?
Amazon Brand Analytics (ABA) is a free tool inside Seller Central for third-party sellers enrolled in Brand Registry. Amazon Retail Analytics (ARA) is a separate tool inside Vendor Central for first-party vendors who sell wholesale to Amazon. ARA comes in Basic and Premium tiers, with Premium carrying a monthly fee. The tools overlap in some data types but serve entirely different business models.
What reports are included in Amazon Brand Analytics?
ABA currently includes six primary dashboards: Search Terms Report, Search Query Performance Report, Search Catalog Performance Report, Market Basket Analysis, Repeat Purchase Behavior Report, and Demographics Report. Customer Loyalty Analytics is a newer addition that segments buyers into loyalty cohorts. The discontinued Item Comparison and Alternate Purchase Behavior report was removed in June 2022.
Who can access Amazon Brand Analytics?
Any seller with an active Professional Selling Plan and enrollment in Amazon Brand Registry can access ABA at no cost. Individual plan sellers and those without Brand Registry do not qualify. Vendors using Vendor Central access a separate tool called Amazon Retail Analytics (ARA) instead.
Conclusion
Amazon Brand Analytics has evolved into an indispensable toolkit for any serious brand owner on the platform. With six active dashboards covering search behavior, catalog performance, purchase patterns, repeat buying, demographics, and customer loyalty, the suite provides data that third-party tools simply cannot match in accuracy. The fact that it is free for Brand Registry sellers makes it one of the highest-value resources available in the Amazon ecosystem.
The key to getting results from ABA is consistency. Reviewing reports weekly, acting on keyword opportunities, diagnosing listing problems through funnel metrics, and tracking retention trends over time compounds into significant competitive advantage. Sellers who treat ABA as a one-time research tool miss the ongoing value of tracking how shopper behavior shifts across seasons and product launches.
If you have not yet enrolled in Brand Registry, that is your first step. Once enrolled, log into Seller Central, navigate to Reports then Brand Analytics, and start with the Search Terms Report. Identify your top five keyword opportunities, update your listings, and measure the results. From there, expand into the Search Query Performance and Market Basket Analysis reports to build a complete picture of how customers discover, evaluate, and return to your brand on Amazon in 2026 and beyond.
Leave a Reply